
Most retailers are running on gut feel and platform defaults.
Your POS, your loyalty platform, and your email service all give you reports. What they don't give you is intelligence. The difference is whether the data is telling you what happened or what to do about it.
Most operators look at the same three numbers every month. Open rate. Same-store sales. Total revenue. None of those tell you which customers are about to lapse, which loyalty tier is underperforming, or where first-visit churn is bleeding margin across your stores.
That's what RetailIQ is built for.
What the dashboard gives you.
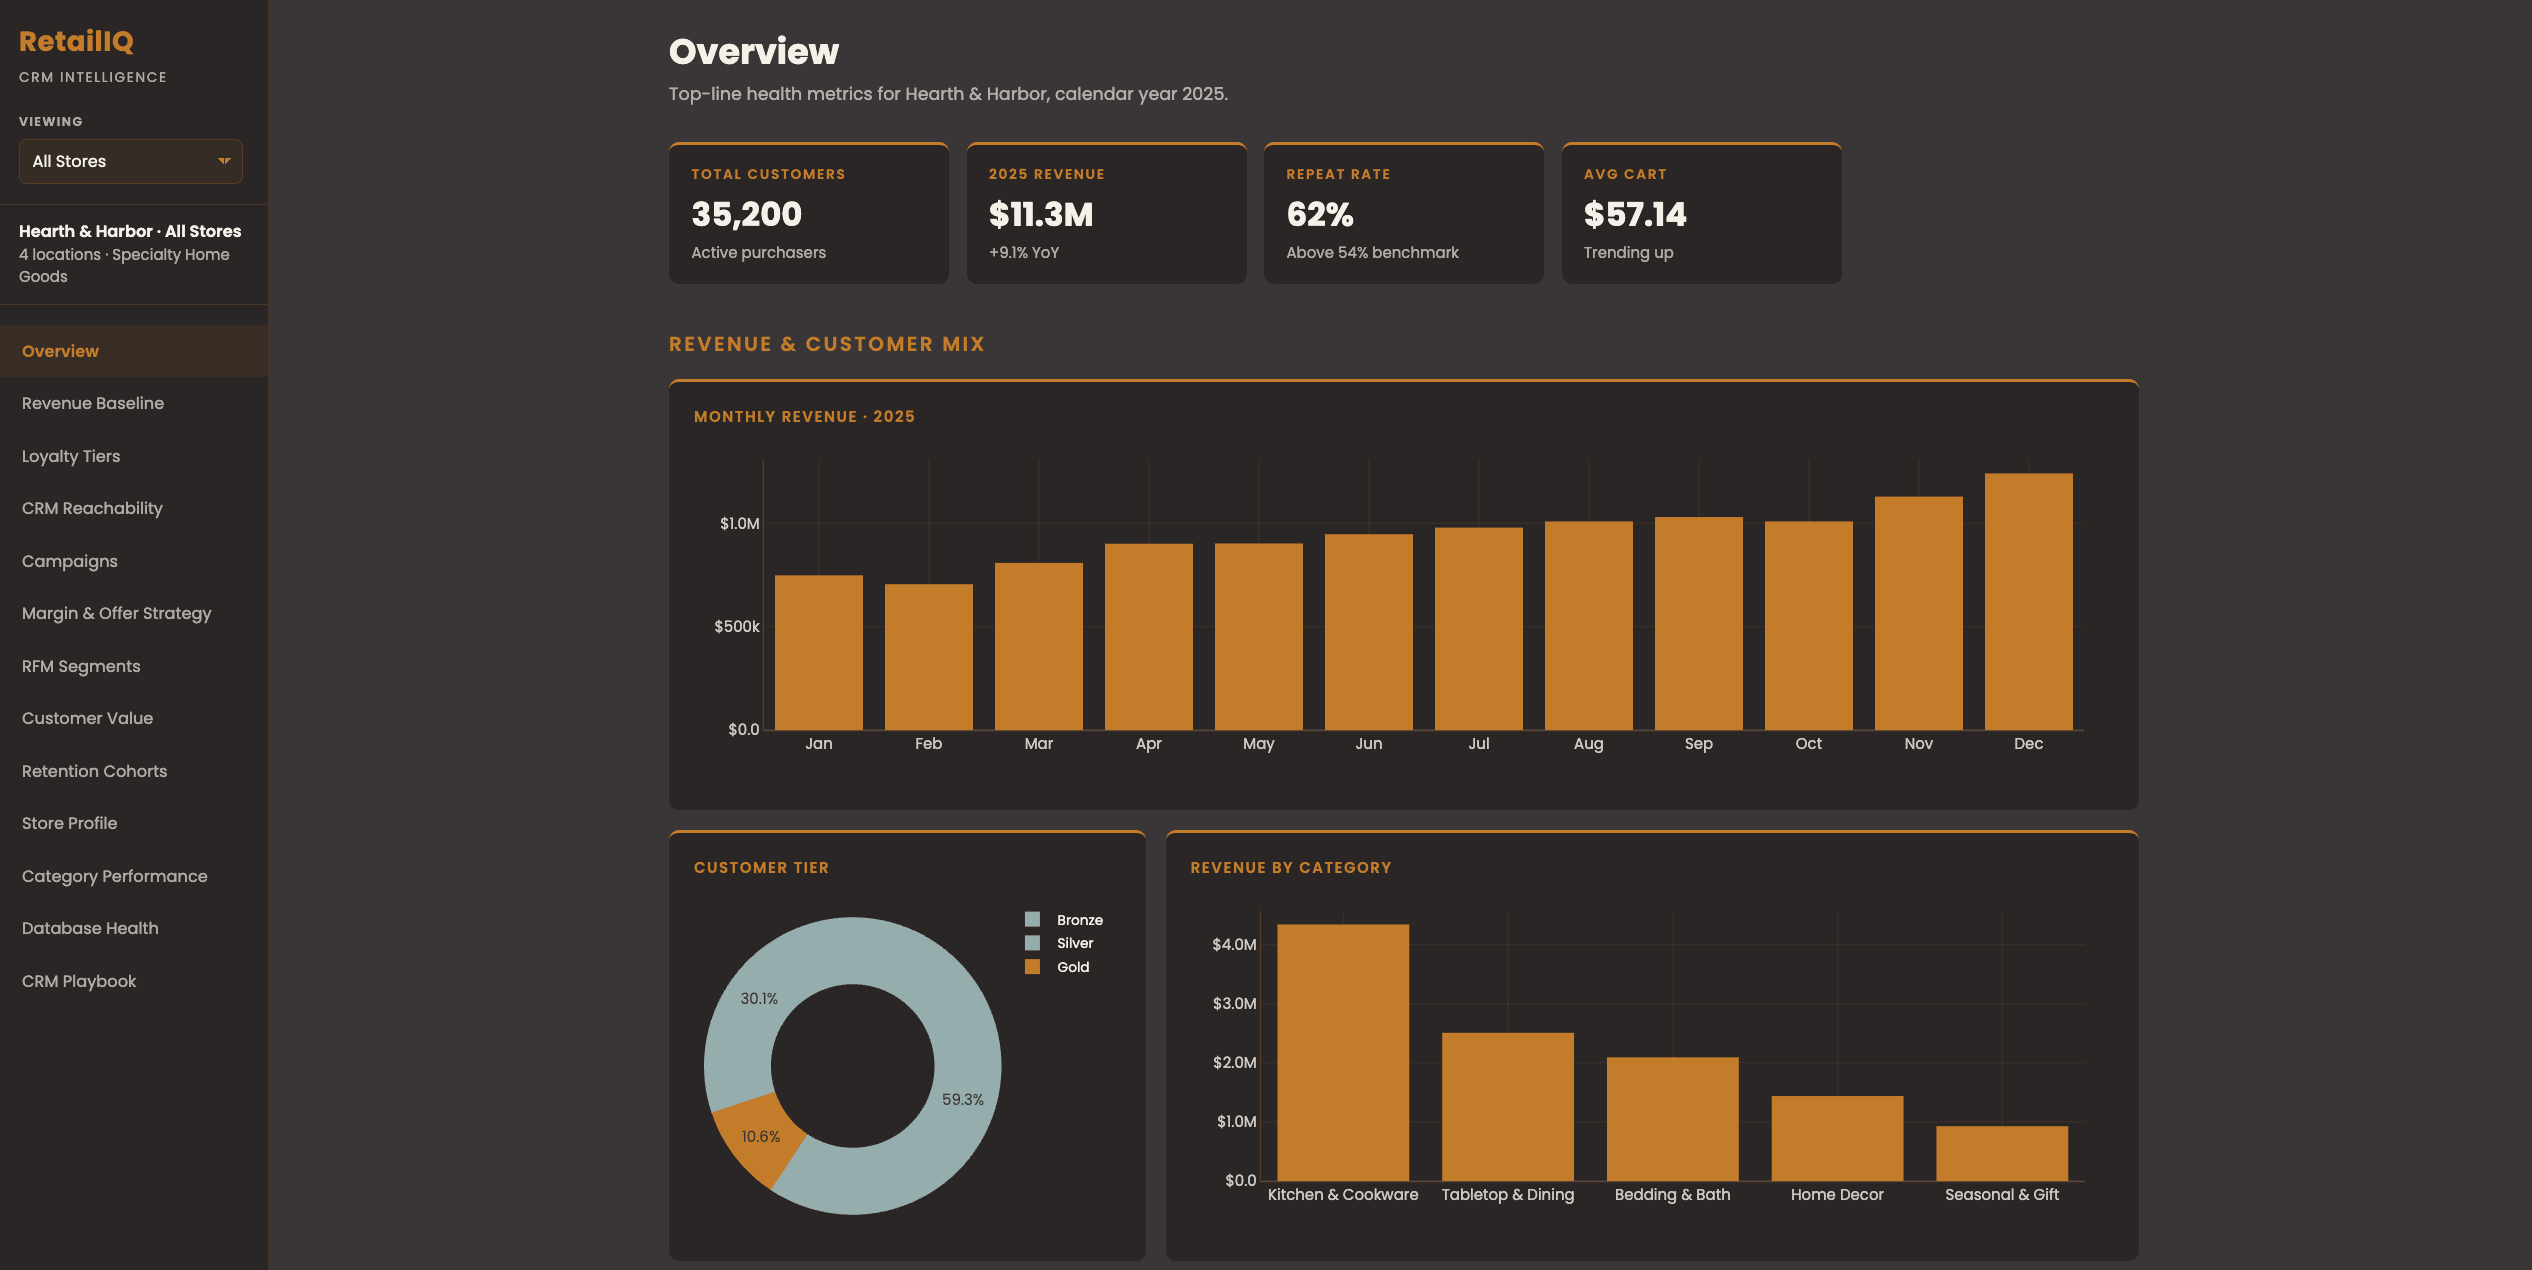
Below, the Overview tab from a sample build for Hearth and Harbor, a four-location specialty home goods retailer.
Diagnostic Intelligence
Understand exactly where your customer base is healthy and where it's leaking. First-visit churn, repeat rate, tier migration, and database health all in one place.
Behavioral Analysis
RFM segmentation, loyalty tier performance, retention cohorts, and category-level basket behavior built from your actual transaction data.
CRM Playbook
Specific campaigns tied to what your data is showing. Not generic best practices. Plays built for your segments, your tiers, and your retention gaps.
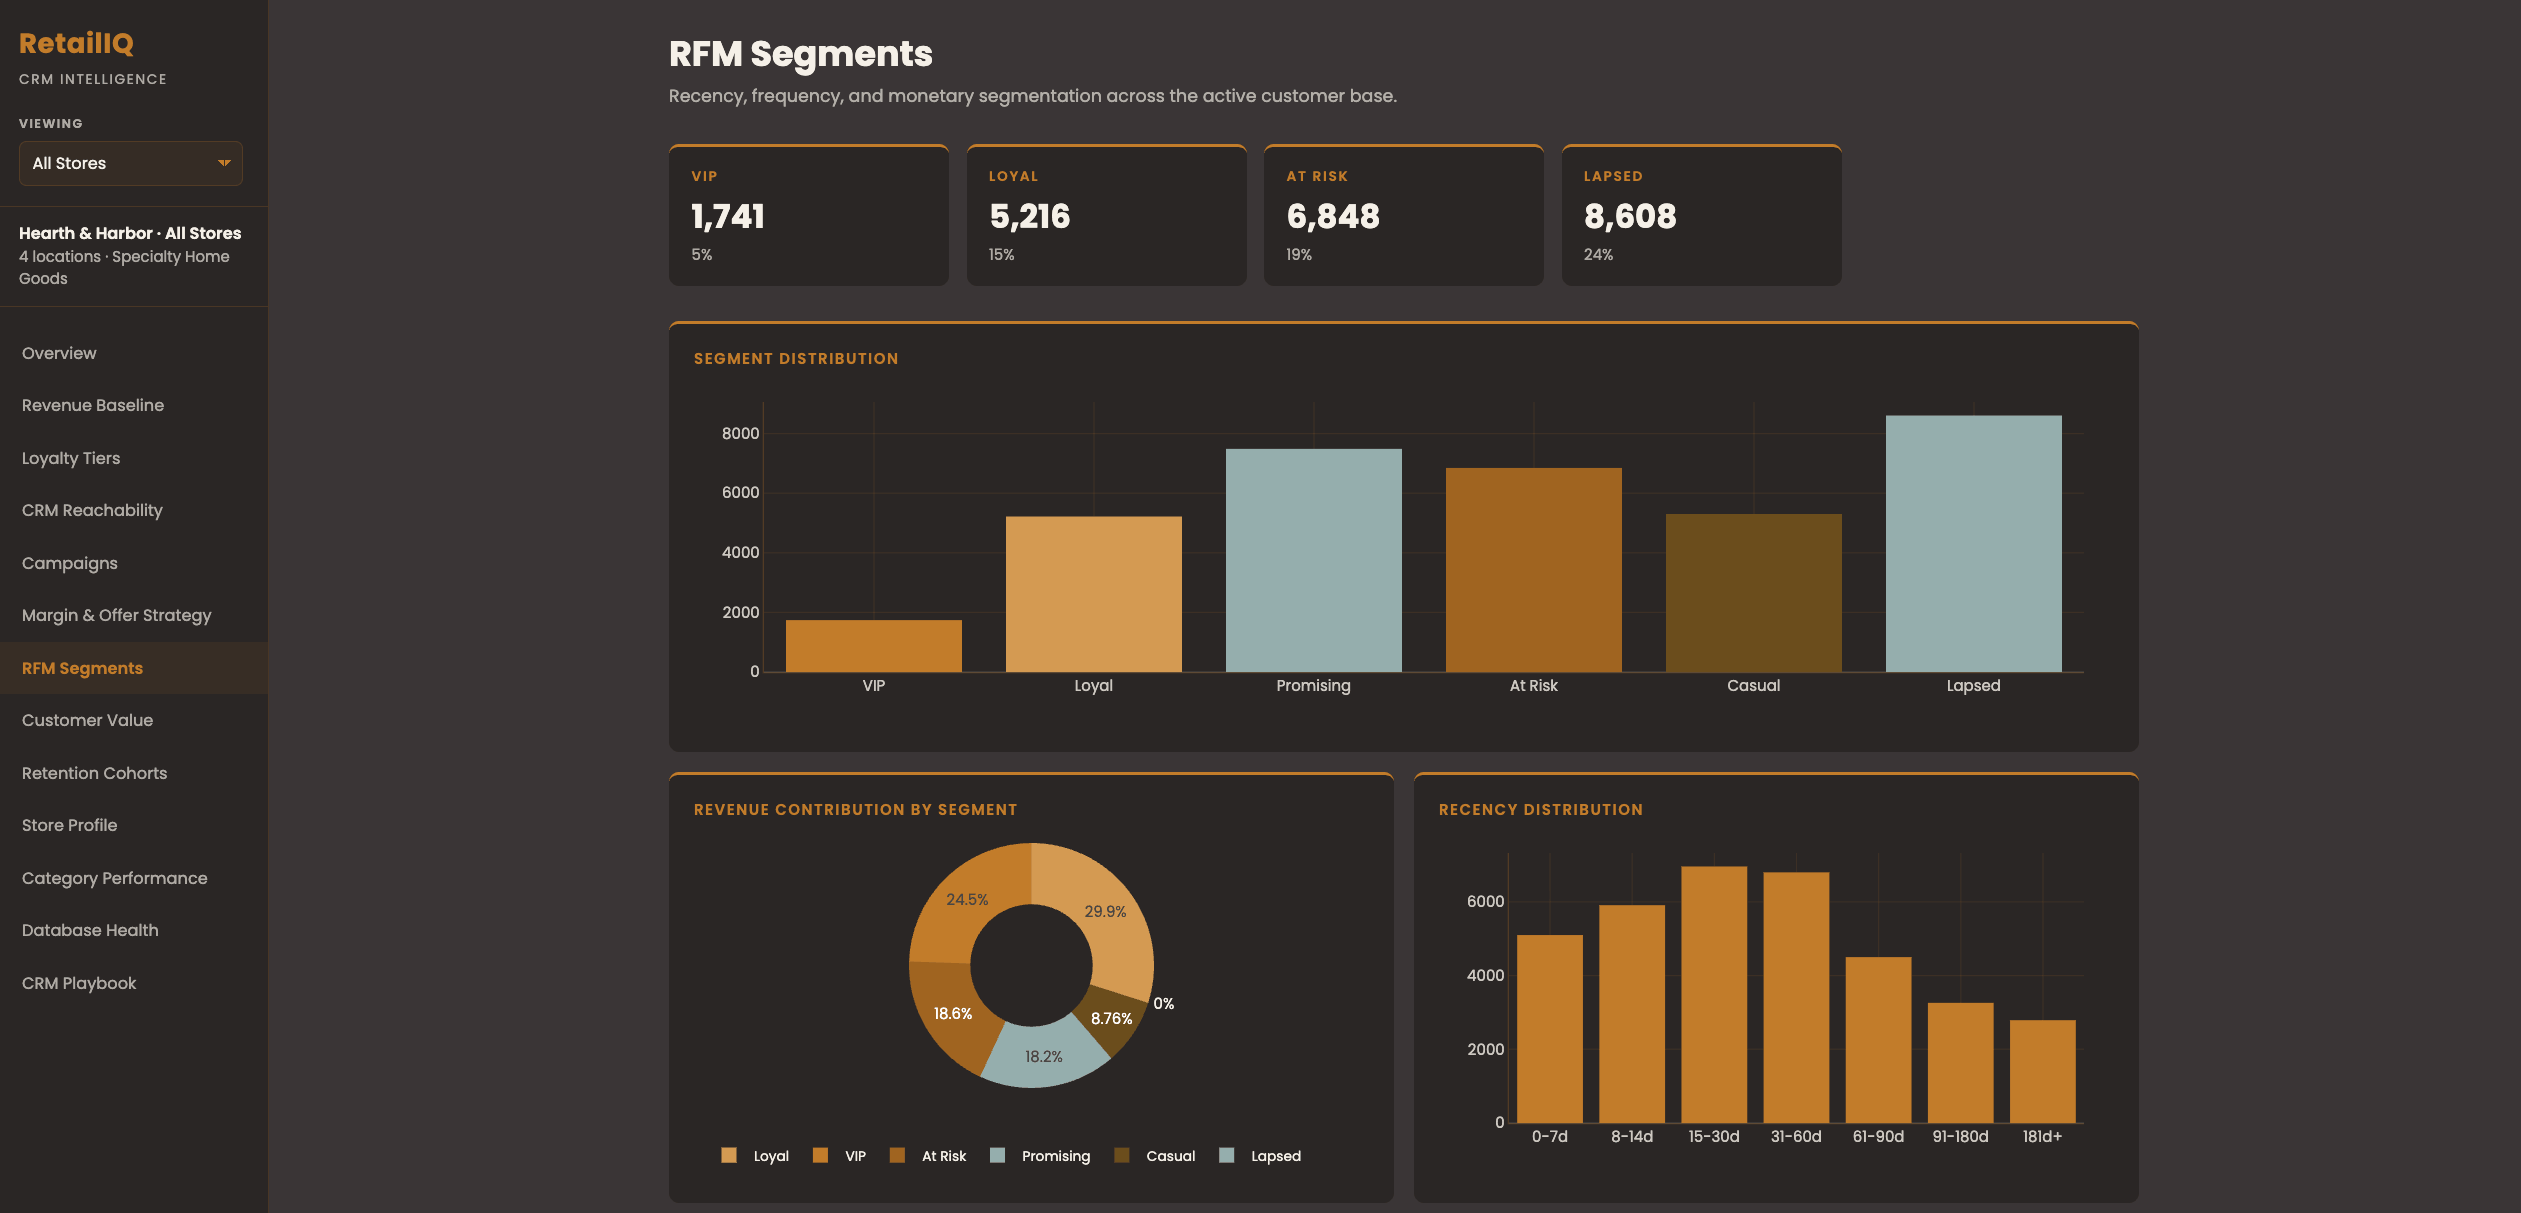
Six customer segments scored by recency, frequency, and spend. VIP and Loyal together generate 54 percent of revenue from 20 percent of the base. At Risk and Lapsed are where retention work pays back hardest.
Three steps to your dashboard.
Connect Your Data
We connect to your POS, loyalty platform, and CRM via API. CSV upload is available for any platform not yet on our integration list.
Build Your Dashboard
We build a custom intelligence layer on top of your data. Every chart, every segment, every insight is specific to your operation.
Execute Your Playbook
You get a living dashboard that updates as your data changes, plus a CRM playbook tied to what the data is actually showing.
Built for multi-location operators.
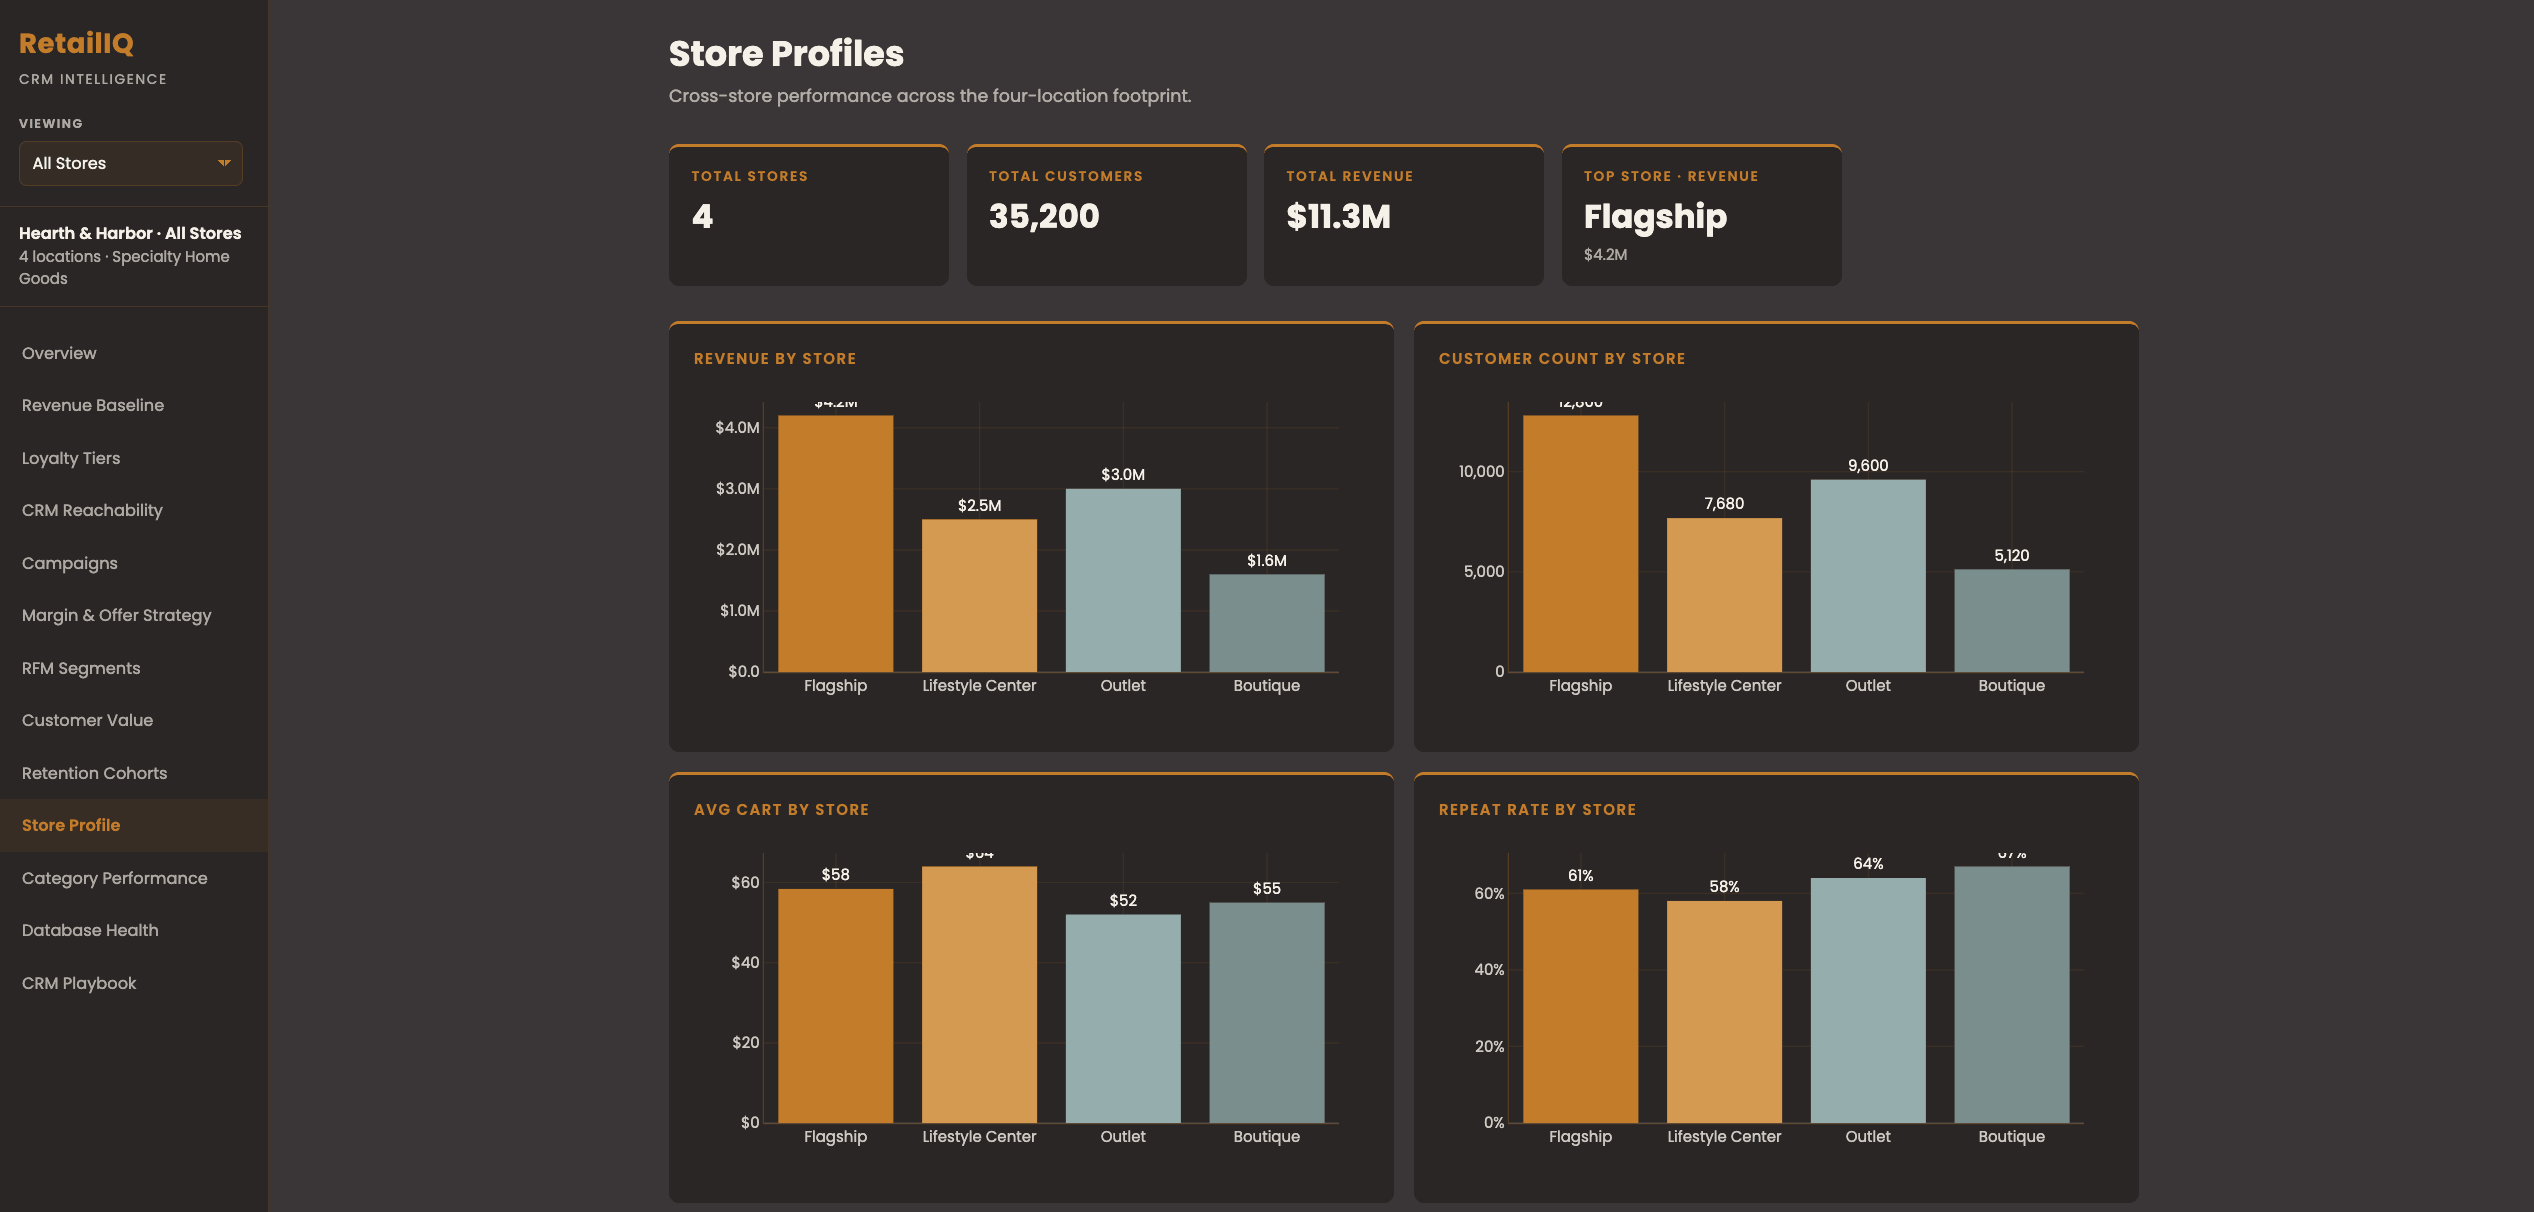
Compare revenue, customer count, average cart, and repeat rate across your stores in one view. Below, the four-location comparison from a sample build.
Straightforward pricing.
Scoped to your operation. No surprises. Every engagement includes build, integration setup, and monthly data refreshes.
- Custom dashboard build
- POS + loyalty integration
- All 13 dashboard tabs
- Monthly data refresh
- CRM playbook included
- Email support
- Everything in Single Location
- Store profile comparisons
- Quarterly business reviews
- Priority support
- Custom segment builds
- Dedicated onboarding
Multi-location pricing scales based on location count and data complexity. Request a demo and I'll give you a specific number for your operation.
See what your data actually looks like.
Request access to the live demo built on synthetic data for a four-location retail operator.
See a Live Demo